As we near the end of the first six months of the second Trump administration, private markets are slowly adjusting to the new realities of ongoing trade wars and a higher-for-longer interest rate environment. For many investors in private markets, the ongoing lack of liquidity has put further constraints on their ability to materially reinvest new capital while those with dry powder find themselves in an opportune position to play offense in selective areas of the market. Fortunately, these investors have been helped by a robust public equity market that continued to post better-than-expected results for the calendar year 2024 and thus far in 2025.
Over the trailing four quarters, ending December 31, 2024, overall private markets posted positive results1. For the segments within private markets that are more highly correlated to the public markets, particularly late-stage venture capital and growth equity funds, notable performers by industry include financial services, consumer, and health care companies. Private real estate funds continue to face headwinds, posting negative returns over the trailing four quarters.
Thematic Insights
Tariffs and Big Tech CapEx Spending
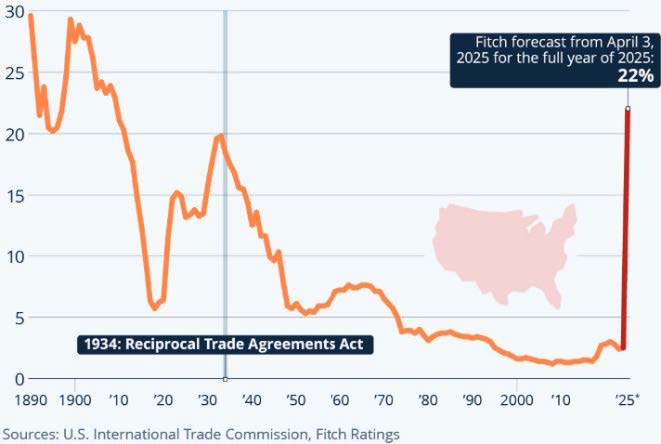
Since the start of the new Trump administration, U.S. trade policy has been at the center of most discussions and resulted in short-term volatility within the broader public equity markets. As seen in the following chart, the average effective U.S. tariff rate has reached its highest point in the last 100 years2:
The long-term extent of the impact of these tariffs is still to be determined, with a likely result of many companies delaying previously scheduled capex spending. While we are closely monitoring, managers within our Private Investment platform have not yet seen any material impact from these tariffs on their underlying portfolio companies. Inevitably, the question for most investors in private equity is whether these tariffs will delay what was expected to be a pivotal year for the exit environment.
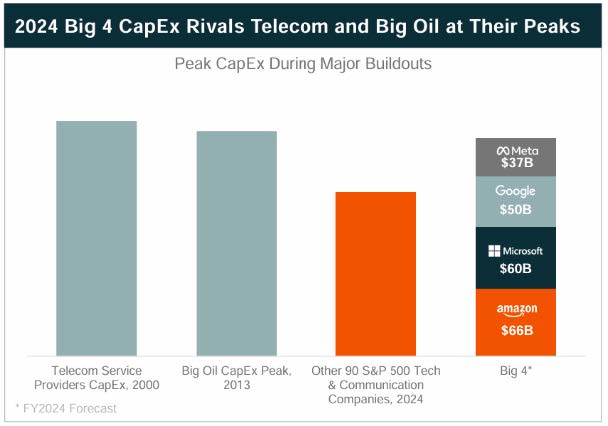
What is clear, however, is that the capex spending by the Big 4 technology companies has been significant3:
U.S. Manufacturing
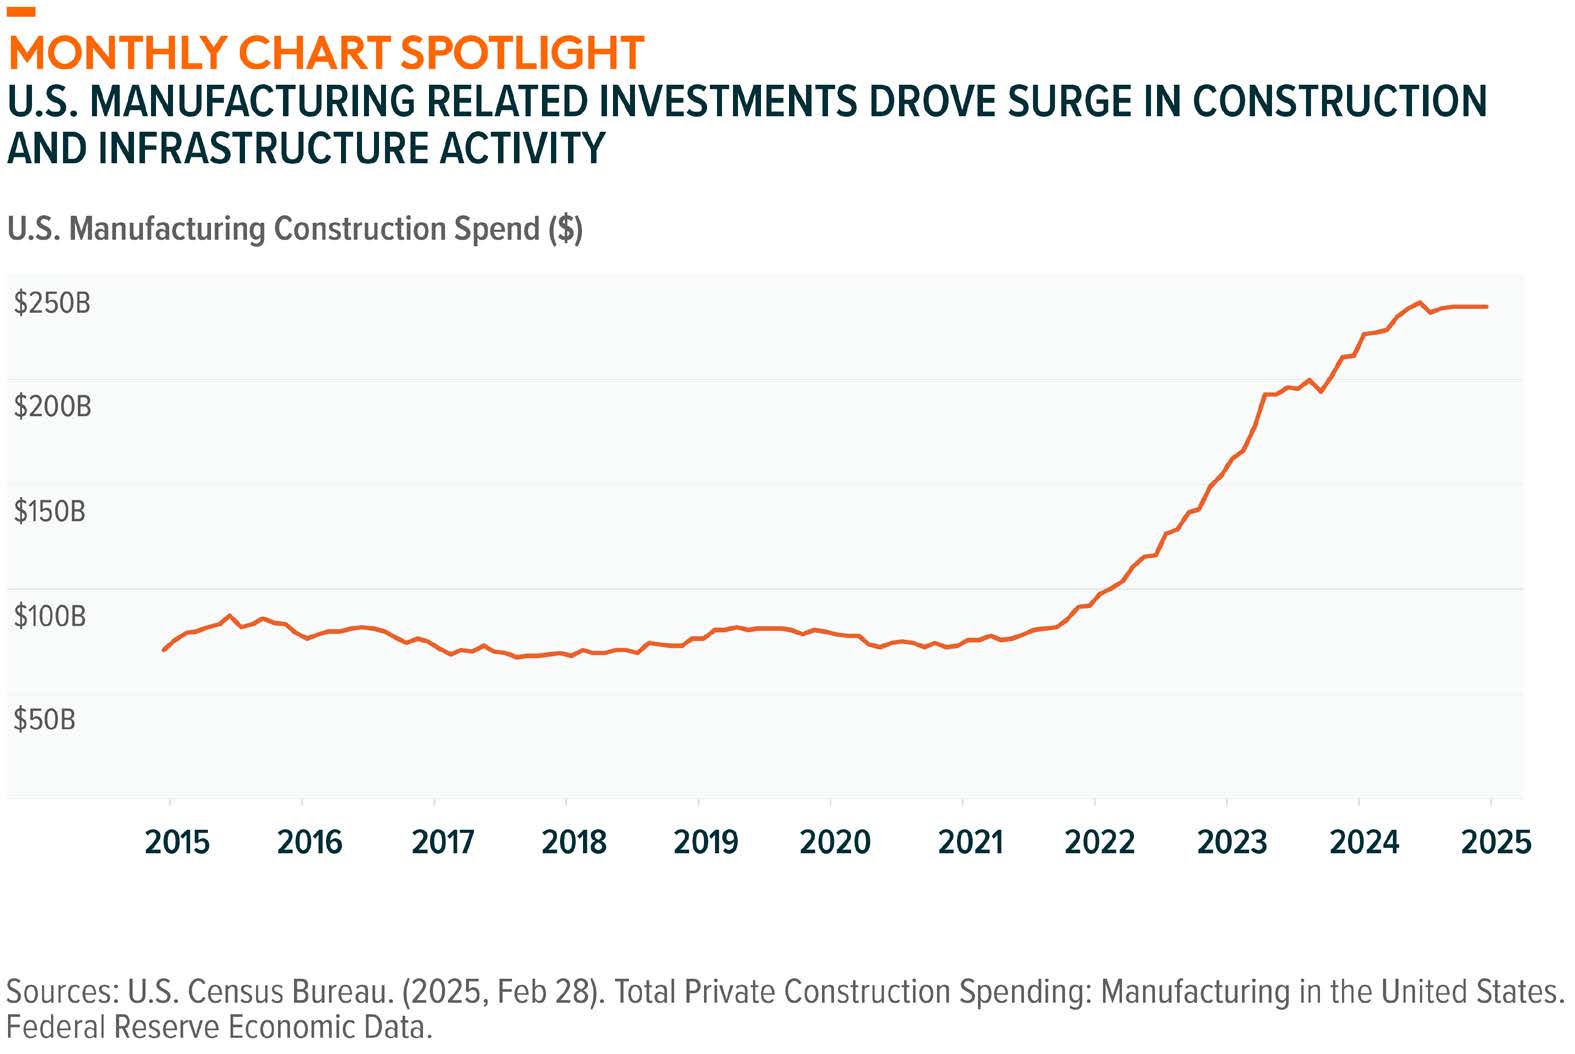
The resurgence in the U.S. manufacturing industry has resulted in a significant increase in construction spending in recent years:
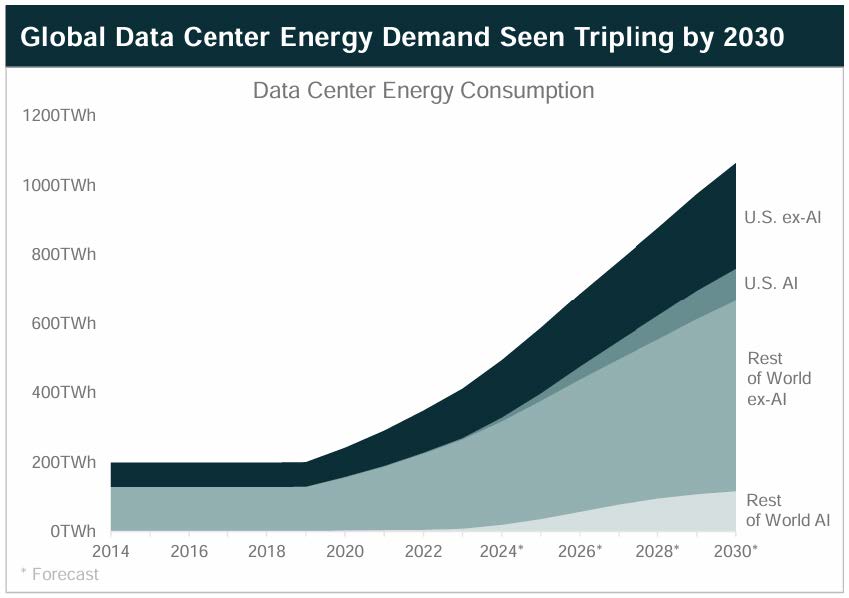
The Big 4 technology companies are a major driver of this growth. Apple, for example, announced a $500 billion investment within the United States over the next four years, aiming to bolster domestic manufacturing, innovation, and job creation4. In addition to advanced manufacturing facilities, many of these large technology companies are also hyper-focused on building dedicated data centers and energy sources to power them. Reliable, readily available energy will be critical over the coming years as energy demand from data centers is projected to triple by 20305:
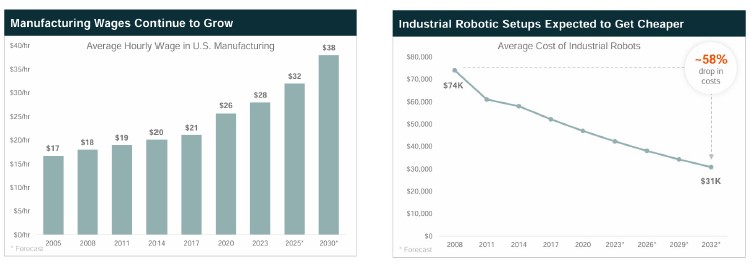
One of the major challenges that the U.S. manufacturing industry faces, however, is the average hourly cost of a U.S. manufacturing worker3. This will likely lead to the continued adoption of automation and use of advanced robotics. Fortunately, the costs of these systems are expected to decline5.
Private Equity Buyout
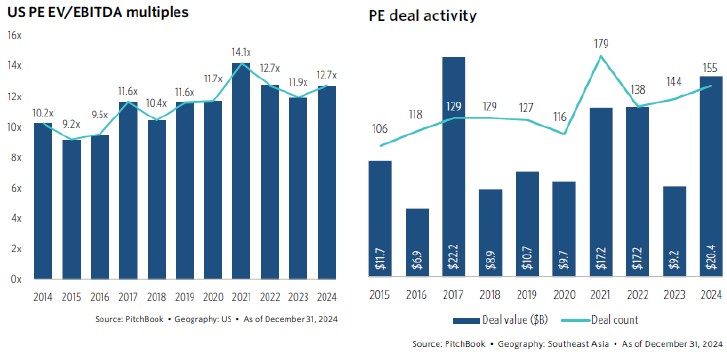
Based on the most recent data available from PitchBook6, valuation multiples in the U.S. buyout segment remained elevated through the end of 2024. After having seen much lower deal activity in 2023, notably congruent with the rise in interest rates, deal activity picked up in 2024 as the Fed began to cut rates:
While activity looks to have picked up so far in 2025, the continuation of this trend will likely depend on several factors, including further geopolitical uncertainty and monetary policy.
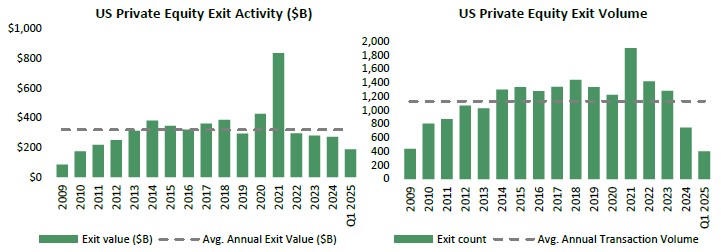
In simplistic terms, investors need liquidity. Liquidity creates a flywheel effect, providing capital to re-invest and improving investor sentiment. The following charts show that exit values continue to trend below historical averages7, both in terms of the dollar value of total transactions and the number of transactions.
Data for the first quarter shows promising signs early on in 2025. While we caution to not always read too much into only one quarter of data, on an annualized basis, the Q1 2025 data would result in these levels trending above historical averages.
Venture Capital / Growth Equity
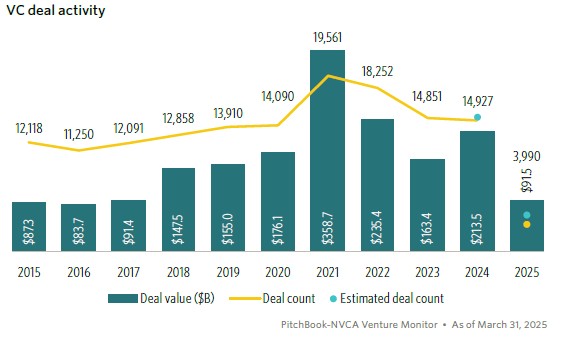
Deal flow activity in the venture capital market remains steady and in-line with levels we have seen in recent years8:
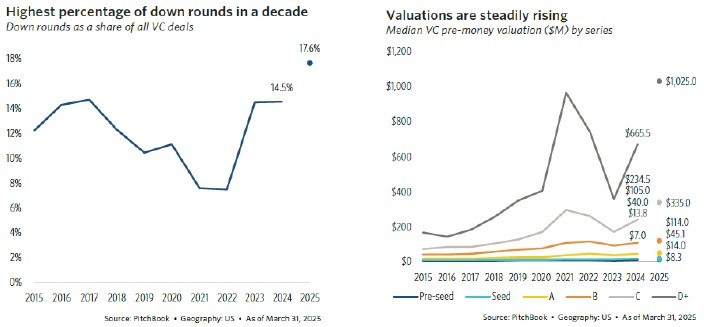
One valuation metric we watch closely, particularly during periods of dislocation, is down rounds. Down rounds represent follow-on funding rounds for venture-backed companies where the valuation is lower than the previous round. As the recovery in the venture capital market has elongated relative to original expectations, companies hoping to extend runways without lowering their valuation expectations must eventually face reality and adjust accordingly. According to recent data from PitchBook, the percentage of down rounds relative to all venture capital deals during the first quarter reached its highest level in a decade9:
The interesting, and starkly contrasting data point to the above chart, is the fact that we are still seeing a climb in median pre-money valuations in venture capital9.
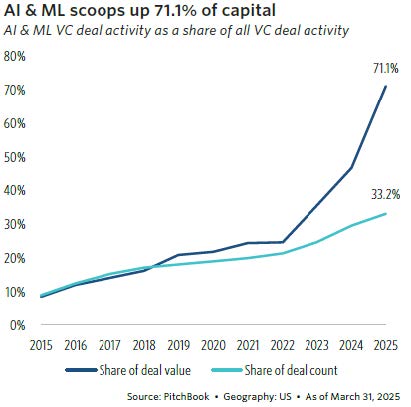
Diving deeper into the data, what is revealed is the headline, median pre-money valuations in venture capital are being driven by deals in Artificial intelligence / machine learning (“AI/ML”) companies. Across other sectors, the venture capital market mostly remains under pressure. In fact, during the first quarter of 2025, AI/ML companies continue to comprise the largest percentage of deal value in the venture capital space9:
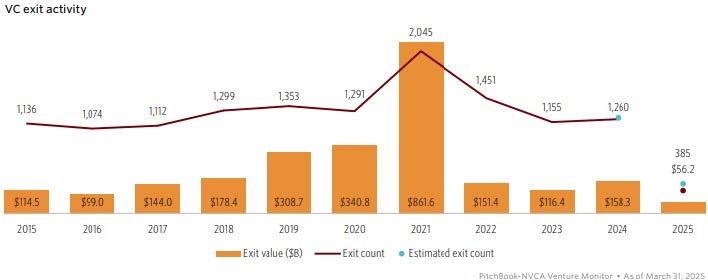
While investment activity in venture capital seems to have stabilized, what has yet to recover is exit activity10. The lack of a robust IPO market and the continued divergence in the bid/ask spread between buyers’ and sellers’ have negatively impacted liquidity:
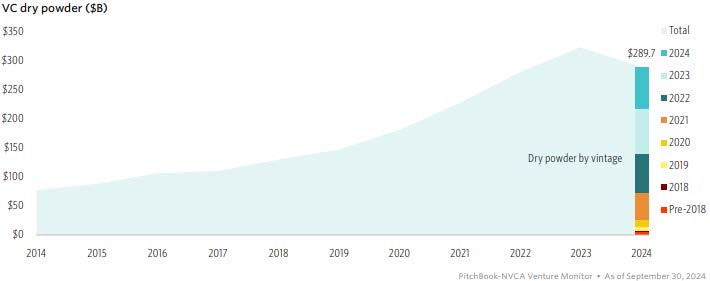
Perhaps one silver lining from the lack of exits is the resulting impact on investor sentiment, particularly for new capital being invested into the venture capital space. As a result, less capital is being committed to venture capital funds, and we are starting to see a reduction in overall dry powder within the U.S. venture capital market10:
Real Assets
Real Estate
We continue to maintain a fundamentally cautious view on the real estate market and have not actively deployed new capital into real estate assets in over five years. Our view continues to be driven by several factors, with an important driver being estimates for forward-looking returns (both on an absolute and relative basis vs. other opportunities in private markets).
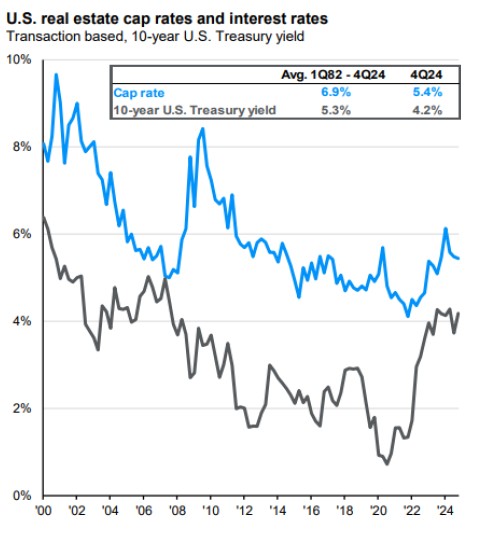
One metric supporting our thesis is cap rate spreads, which we regularly provide an update on in our letters. Tracking cap rate spreads (implied cap rate / 10-year U.S. Treasury yield) is important for a real estate investor as an assessment of a property’s yield potential over a certain period relative to what you could earn investing in a “risk-free” investment.
Since our last letter, nothing has materially changed with regards to cap rate spreads. Across the U.S. real estate market, cap rate spreads remained tight through the end of 202411:
Many factors can influence a property’s cap rate, including interest rates, rent growth, overall economic indicators such as GDP, and property-specific characteristics such as location and property type.
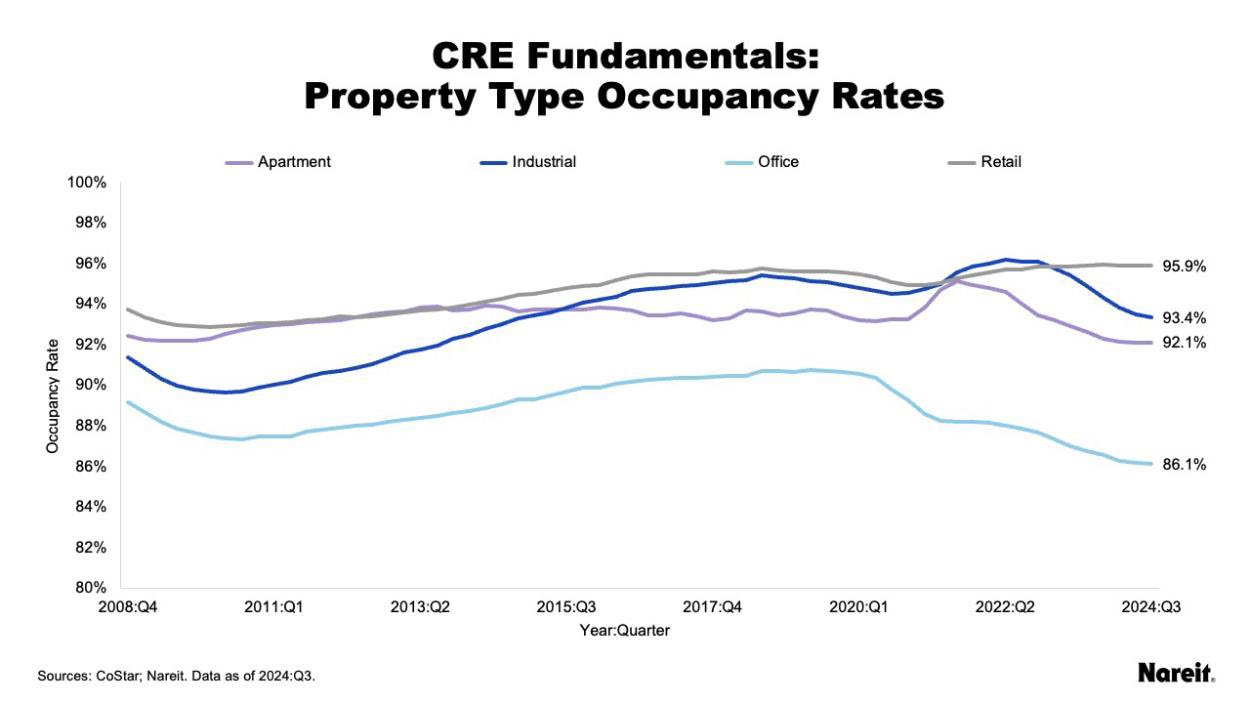
Our current views on the real estate market are further supported by increasing vacancy rates (mostly driven by supply and demand dynamics across sub-markets) across most sub-categories. As seen in the following chart, all segments except for retail (which has recovered from the COVID lows) have seen further deterioration in occupancy rates. Even with return-to-office policies enacted by many companies, the overall weakness in office employment growth continues to weigh on the sector. In fact, the office sector has now experienced its fifth year of declining tenant demand12.
Energy / Natural Resources
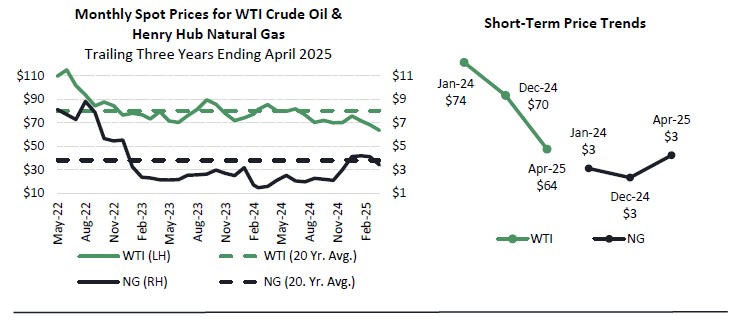
Oil prices were down approximately 5.4% for the calendar year 202413, trending below the 20-year average price per barrel as overall macro-related headlines weighed the outlook for projected demand. Throughout 2024, natural gas continued to trend below its historical 20-year average pricing level. After a much colder winter pattern in late 2024 and into early 2025, natural gas prices rebounded near the end of 2024, up approximately 13.6% through the end of April 2025. What is even more staggering and shows just how volatile commodity markets can be is that natural gas prices, on a YoY basis ending April 2025, were up over 100%.
We hope that this semi-annual letter serves as a helpful reference on the current market conditions and our approach to investing in private markets. Our team members are always available to answer any questions. Thank you for your continued interest and support.
Sources: [1 ] MSCI / Burgiss Private Capital Intel [2] Census Bureau, U.S. International Trade Commission, Tax Foundation, April 2025. [3] Forthlane Partners, Andrew Sarna, Off the Charts: Global X Next Big Theme Report [4] https://www.apple.com/newsroom/2025/02/apple-will-spend-more-than-500-billion-usd-in-the-us-over-the-next-four-years/ [5] Forthlane Partners, Andrew Sarna, Future Trends, https://open.substack.com/pub/offthecharts/p/future-trends?utm_campaign=post&utm_medium=web [6] PitchBook: Q1 2025 US PE Breakdown Report [7] PitchBook Q1 2025 US PE Breakdown [8] PitchBook-NVCA Venture Capital Monitor, Q1 2025 [9] PitchBook: Q1 2025 US VC Valuations and Returns Report [10] PitchBook-NVCA Venture Capital Monitor, Q1 2025 [11] NCREIF, JP Morgan; data as of February 28, 2025 [12] Crow Holdings, 2025 Real Estate Outlook [13] U.S. Energy Information Administration
Important Disclosures
This report shall not constitute an offer to sell, or a solicitation of an offer to buy the interests in Bespoke Private Strategies, LP. No such offer or solicitation will be made prior to the delivery of a definitive private placement memorandum, limited partnership agreement and other materials relating to the matters herein. Before making an investment decision with respect to the fund, potential investors are advised to read carefully the confidential private placement memorandum, the limited partnership agreement and the related subscription documents, and to consult with their tax, legal and financial advisors. An investment in any of these limited partnerships is speculative and involves certain risks and conflicts of interest described in more detail in the private placement memorandum. All investments involve risk including the loss of principal or total loss.
Any indices or other financial benchmarks shown are provided for illustrative purposes only, are unmanaged, reflect reinvestment of dividends and other income and do not reflect the impact of advisory fees. Investors cannot invest directly in an index. Comparisons to indices have limitations because indices have volatility and other material characteristics that may differ from a hedge fund. Any indices or other financial benchmarks used herein were not selected to represent an appropriate benchmark to compare an investor’s performance, but rather to allow for comparison of the investor’s performance to that of a well-known and widely recognized index.
Different types of investments involve varying degrees of risk, and there can be no assurance that the future performance of any specific investment, investment strategy, or product or any non-investment related content, made reference to directly or indirectly in this newsletter will be profitable, equal any corresponding indicated historical performance level(s), be suitable for your portfolio or individual situation, or prove successful. Due to various factors, including changing market conditions and/or applicable laws, the content may no longer be reflective of current opinions or positions. Moreover, you should not assume that any discussion or information contained in this newsletter serves as the receipt of, or as a substitute for, personalized investment advice from Lowe, Brockenbrough & Company, Inc. dba Brockenbrough. To the extent that a reader has any questions regarding the applicability of any specific issue discussed above to his/her individual situation, he/she is encouraged to consult with the professional advisor of his/her choosing. Lowe, Brockenbrough & Company, Inc. is neither a law firm nor a certified public accounting firm and no portion of the newsletter content should be construed as legal or accounting advice. A copy of the Lowe, Brockenbrough & Company, Inc.’s current written disclosure statement discussing our advisory services and fees is available upon request.
The opinions expressed are those of Brockenbrough. The opinions referenced are as of the date of publication and are subject to change due to changes in the market of economic conditions and may not necessarily come to pass. Forward looking statements cannot be guaranteed. Brockenbrough is an investment advisor registered with the U.S. Securities and Exchange Commission. Registration does not imply a certain level of skill or training. More information about Brockenbrough’s investment advisory services can be found in its Form ADV Part 2, which is available upon request.
Semi-Annual Private Investment Commentary