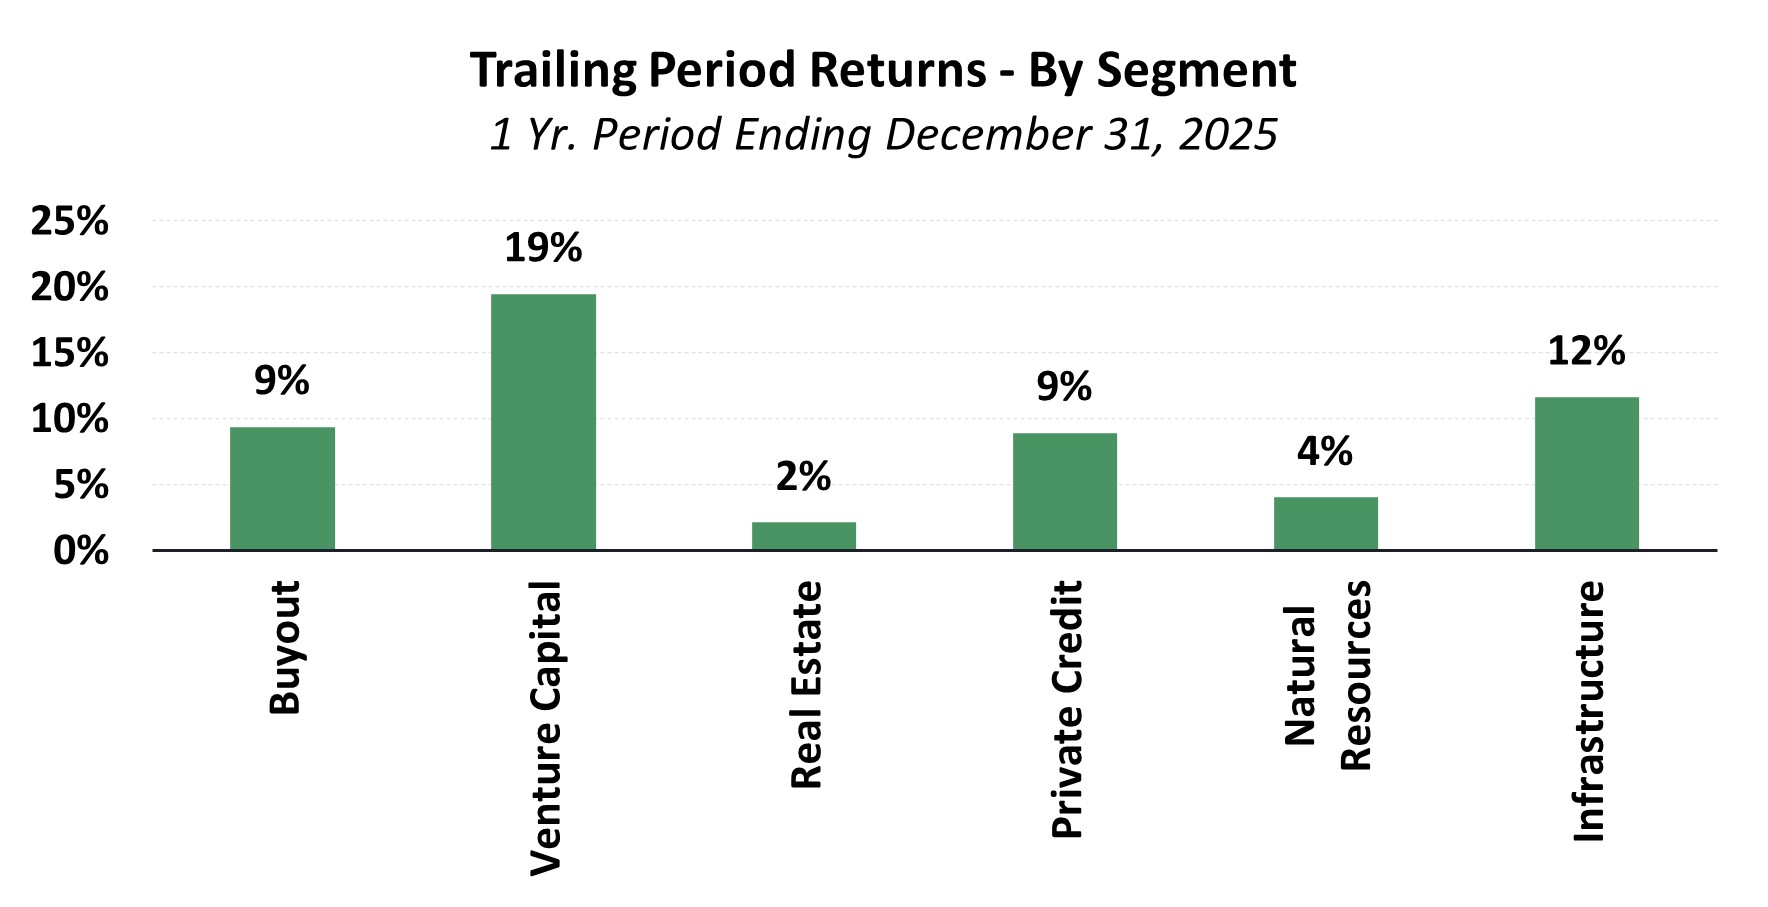
Private market results remained highly uneven across sub-categories in calendar 2025. Venture capital and infrastructure funds posted the strongest performance, while real estate and natural resources continued to lag1. More broadly, private markets appear to be moving from a period defined primarily by valuation resets, higher rates, and limited exit activity toward one in which selectivity, liquidity discipline, and manager quality are likely to matter more than broad asset-class beta.
Performance in most segments has trailed public equity indices, and ongoing pressure on distributions—coupled with uneven IPO and M&A windows—has prompted many limited partners to reassess pacing and prioritize re-up commitment decisions. Consistent with our views voiced in past letters, successful private markets programs demand patience through market cycles.
As we enter 2026, our pipeline remains strong across both lower middle-market buyouts and venture capital. These are core focus areas where we believe secular growth trends, disciplined underwriting, and high-quality manager selection can drive attractive long-term outcomes.
Thematic Insights
Software Exposure & Impact of AI
Software and software-enabled businesses, long a significant value driver for many private equity investors, have faced new pressures as AI compresses or displaces certain workflows. Public market net retention rates have softened, with similar dynamics expected to migrate into private portfolios over the next 12–24 months. Sponsors must now underwrite genuine product reinvention and operational improvement rather than relying on multiple expansion alone.
We believe software exposure remains an important component of a diversified private markets portfolio, but the drivers of future returns have become more nuanced. In early and growth stage venture capital, we generally favor managers with concentrated exposure to AI-native companies positioned to benefit from the structural forces reshaping legacy software stacks, while avoiding undue exposure to businesses more vulnerable to displacement. As companies mature, we place greater emphasis on managers who can create value through tangible operating improvements, rather than simply relying on valuation support or category-level growth.
AI Infrastructure
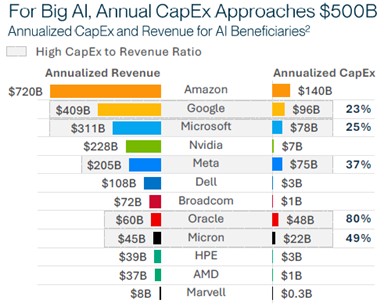
AI infrastructure—spanning compute (chips/semiconductors), physical assets (data centers, cooling, networking), and power—dominated private market activity in H2 2025 and into early 2026. Demand and capital spending from hyperscalers were a major driving factor2:
AI-related transactions continue to impact overall deal activity with ~65% of U.S. VC value (~$222 billion of ~$339 billion total) directed to AI-related deals. IT infrastructure and hosting alone exceeded $109 billion of funding last year3. Power constraints have driven PE into energy assets, utilities, and behind-the-meter solutions. This is especially the case in natural gas assets, which have been seen as particularly compelling given the backdrop. According to a report by Cushman & Wakefield4, the U.S. currently has approximately 40-41 GWs of data center capacity and current estimates projected 148 GW needed by 2030.
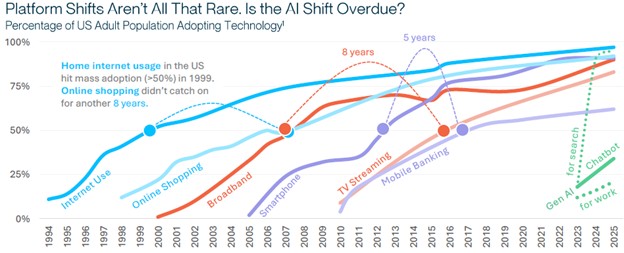
While the enterprise use-case for AI is driving significant demand for compute and other buildouts within the data infrastructure space, AI adoption is seeing signs of broad-based adoption. This is also occurring at a faster pace than was seen in the curves of past adoption cycles5:
AI adoption is also becoming mainstream at private equity firms, fundamentally transforming private equity due diligence by dramatically accelerating processes, improving accuracy and depth of insights, and shifting human focus from rote tasks to high-judgment analysis. While speed and efficiency gains are notable value-adds, AI is importantly assisting teams in enhanced risk detection and quality control. Predictive analysis is becoming instrumental for deal teams as it excels at cross-referencing documents to spot inconsistencies, anomalies, red flags, and hidden patterns.
Private Equity Buyout
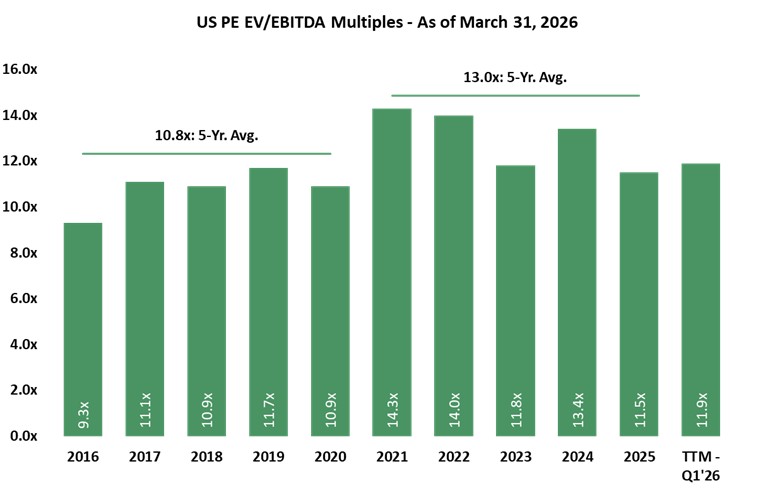
U.S. and global buyout activity recovered meaningfully in H2 2025. Global PE investment reached approximately $904 billion (+44% YoY), with average deal size hitting records (~$1.2 billion) and 13 transactions over $10 billion driving most of the growth6. Median U.S. PE EV/EBITDA multiples settled near 12x at year-end and through the first quarter of 2026, consistent with post-2022 range7:
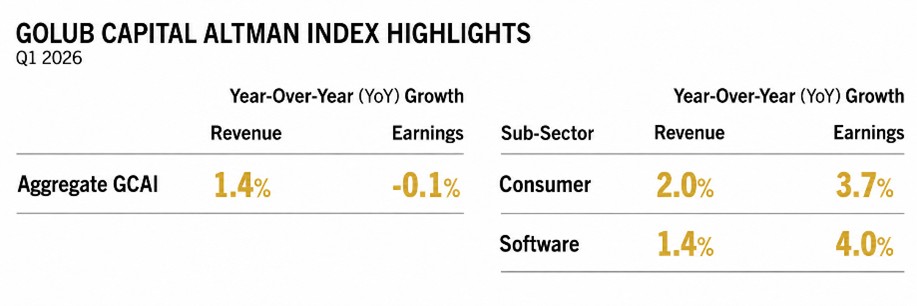
While there are pockets of contraction in certain industries, particularly manufacturing and industrials, fundamentals remained generally supportive of valuations, particularly in the middle market where portfolio company fundamentals continue to prove resilient as represented by the Golub Capital Altman Index which pointed to mid-single-digit revenue growth and roughly flat earnings growth through late 20258:
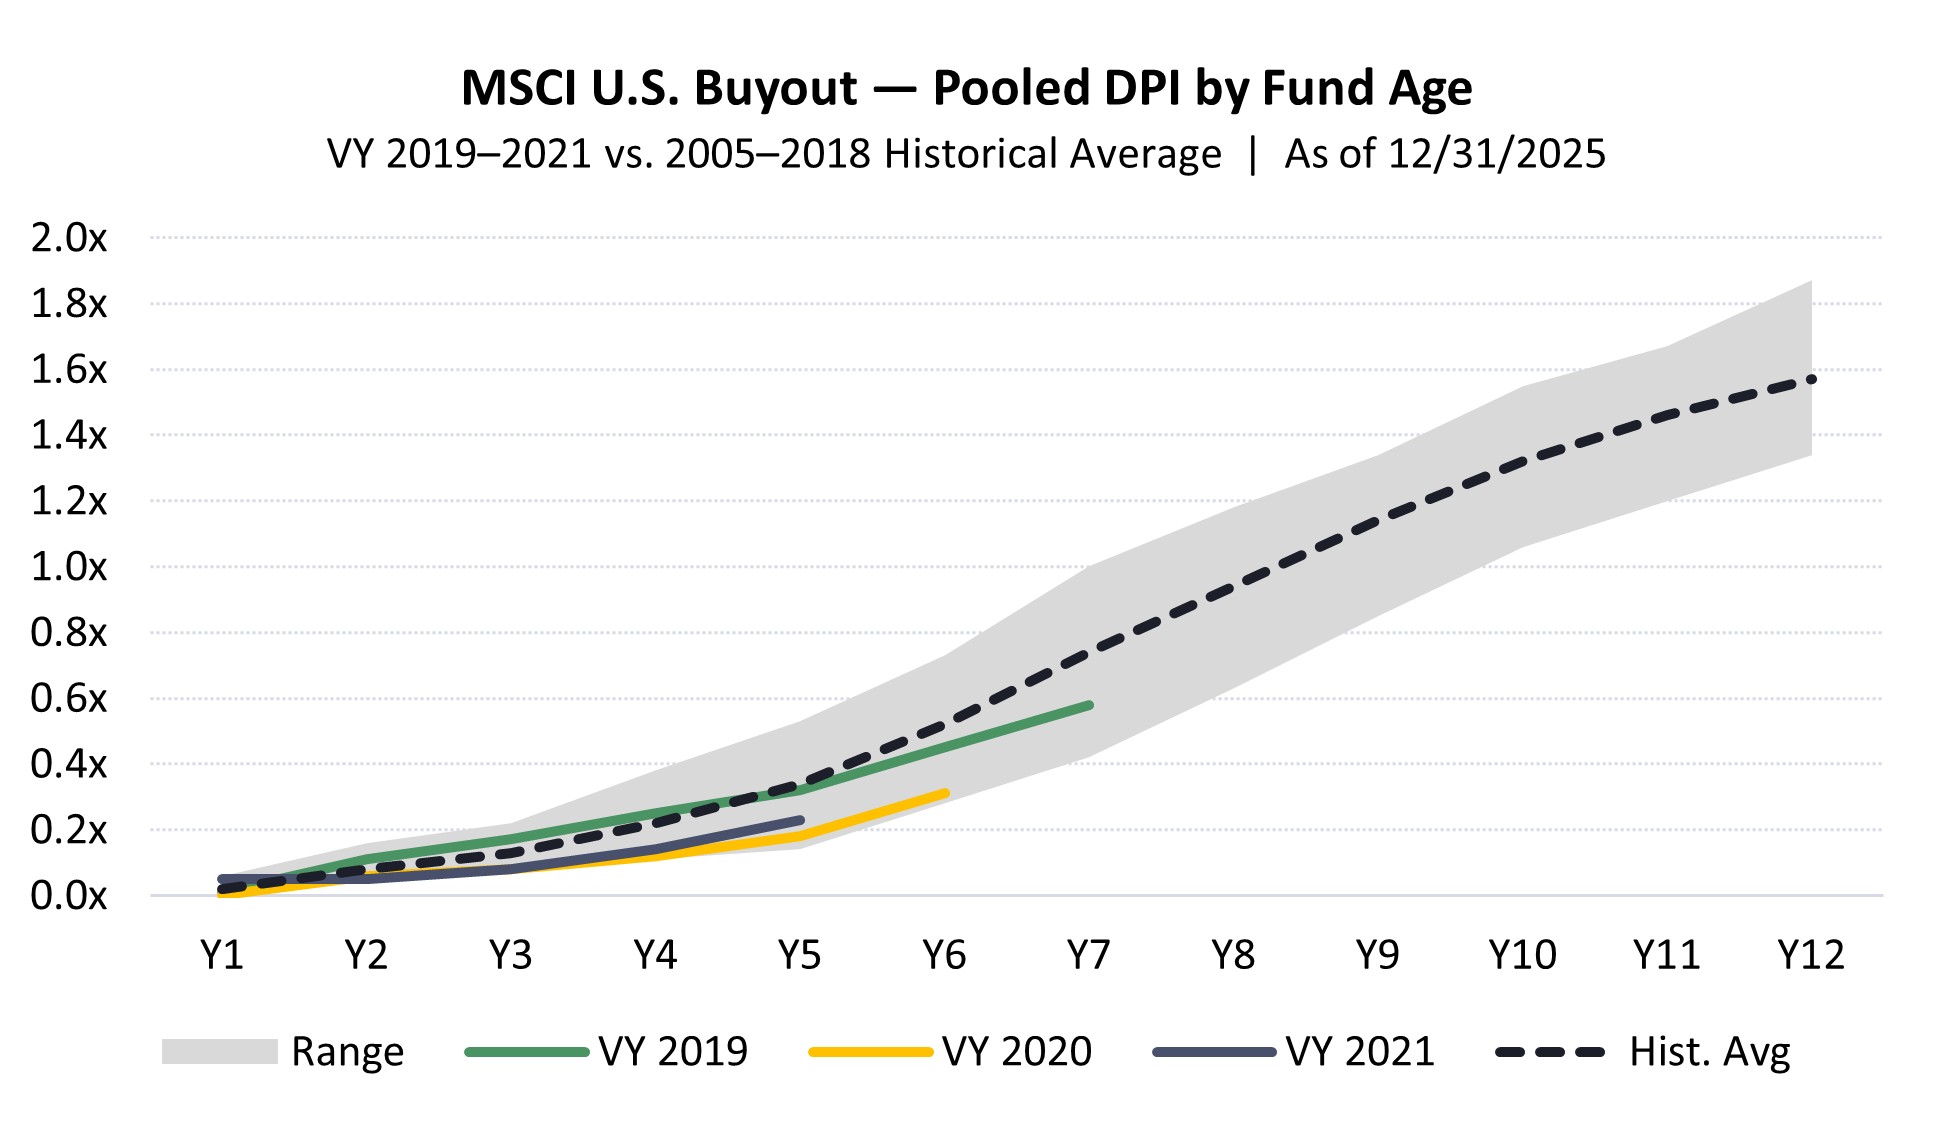
The Federal Reserve’s three rate cut decisions in the last half of 2025 eased financing constraints and resulted in improving exit conditions—global buyout-backed exit value +47% to $717 billion—with sponsor-to-sponsor activity, dividend recaps, continuation vehicles, and selective IPOs contributing9. Improving conditions, however, ultimately need to translate into liquidity for private equity investors. Looking at the cumulative Distributed-to-Paid-In Capital (“DPI”) for buyout funds with vintage years between 2019 and 2021, data shows they continue to trend below normalized levels compared to a typical buyout fund’s full life cycle10. This continues to impact sentiment and underscores the importance of near-term liquidity, particularly over the next 12-18 months.
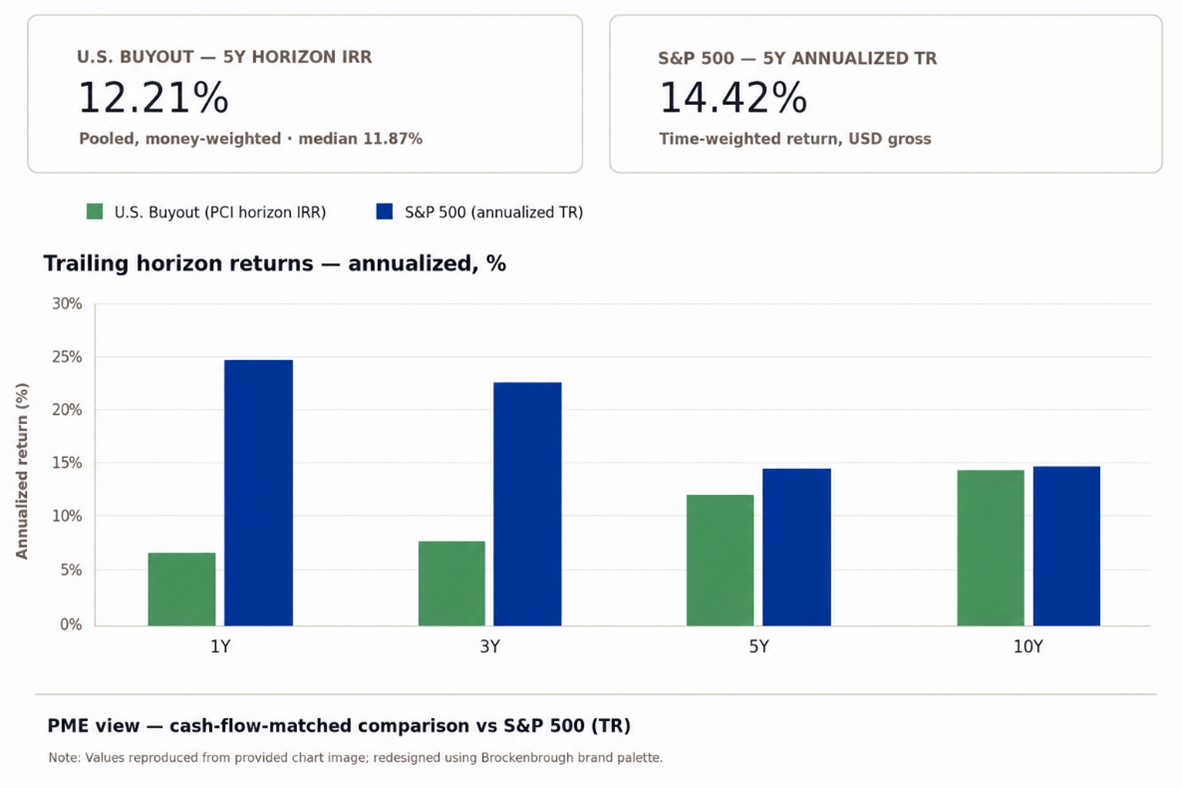
A number of investment committees frequently find themselves discussing the recent underperformance of buyout funds relative to the public markets. Generally, investors expect the performance of an illiquid investment to generate a liquidity premium, most often in the range of 300 bps above the chosen public market benchmark. In more recent years, this has been a challenge to achieve given the strong results the broader indices have produced. Longer-term results, however, remain supportive for buyout investors11.
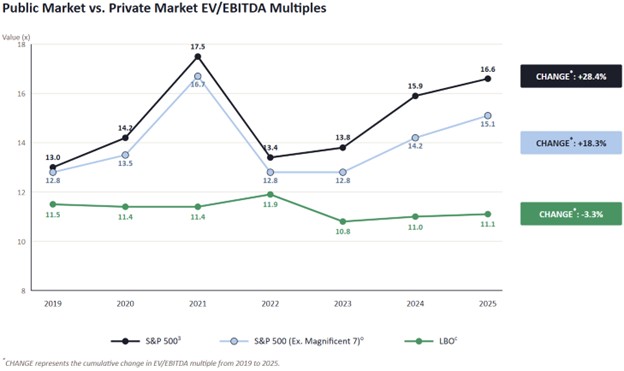
Diving deeper into the spread in performance requires analytics across multiple vectors, including deriving an informed view on metrics such as valuation multiples. Given the recent outperformance of public markets, however, the valuation spread between the public and private markets has materially widened over the past couple of years12. While the historical 10-year average spread is approximately 250 bps, as of year-end 2025, the spread measure stood at approximately 490 bps.
Given the directional divergence shown in recent years, the natural conclusion is that either the public markets have become richly valued or the buyout market is primed to see improved valuations based on market comparables. While the latter scenario can be assessed based on fundamental analysis of underlying portfolios, it is important to note the spread is more often a contemporaneous / lagging indicator of public market valuation movements rather than a reliable, standalone leading indicator of future private market returns. Ultimately, operating results at underlying portfolio companies and broader macroeconomic stability that drives a robust and healthy exit environment are among the most important drivers. We believe this is an exact environment that further supports our playbook of partnering with proven operators who more prudently use leverage to consistently drive value creation through growth and operational improvements.
Venture Capital / Growth Equity
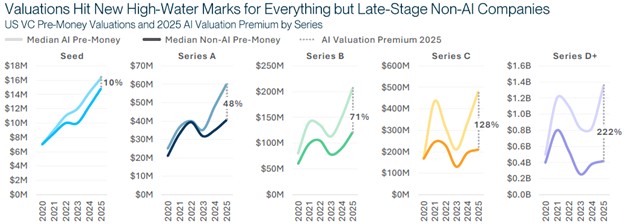
The valuation picture in U.S. venture capital remained sharply bifurcated through year-end 2025. Across all stages, AI rounds continued to command premium pricing. In the later stages, this was particularly driven by a small set of well-known names. In contrast, non-AI, later stage rounds were broadly flat to down versus 2024 levels13.
This is being driven by investor conviction increasingly concentrated in AI and machine learning opportunities. PitchBook's 2025 valuations report notes that AI-related deals continued to account for a disproportionate share of capital deployed — both in dollar value and in late-stage round size14. The result is a market in which the headline figures continue to post new highs, while the non-AI segments of venture capital continue to be led by careful cash runway management and selective insider rounds.
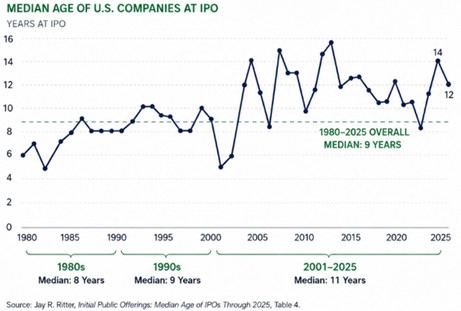
Consistent with the liquidity challenges facing the buyout segment, distributions from venture capital funds have continued to trail historical averages, partially driven by companies staying private longer. The median age of a company at IPO is now well above its long-run norm — roughly 12 years — compared with the 8-to-9-year median that prevailed in the 1980s-1990s.
There are significant IPO candidates across AI infrastructure, enterprise software, cybersecurity, fintech, and data / analytics. A healthier IPO window would be constructive for venture distributions, but we would not expect a single quarter of new listings to fully resolve the liquidity backlog built up over the last several years. Many companies that could go public are likely to do so, selectively, and only if valuation expectations, market volatility, and business performance are aligned.
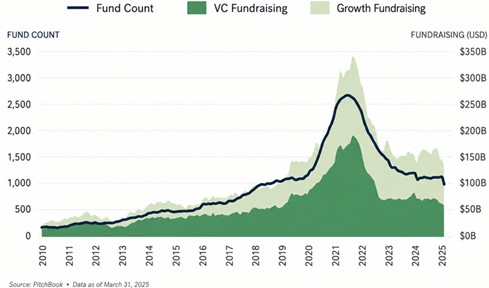
The continued lack of liquidity remains a headwind for venture capital fundraising figures. Limited partners are more selective, often favoring existing relationships, proven managers, and strategies with clear paths to realizations.
For our program, this environment reinforces our preference for managers with disciplined entry valuations, meaningful ownership percentages, and portfolio companies that are not solely reliant on one exit path. For new pipeline opportunities in venture capital, we remain constructive but selective. We continue to emphasize differentiated access, realistic underwriting assumptions, and managers positioned to benefit from durable technology adoption without relying solely on the continuation of premium AI valuations. In our view, some of the best opportunities are likely to come from businesses where AI expands the addressable market or materially improves productivity, rather than from businesses where the investment case depends only on the broad AI theme.
Real Assets
Real Estate
Our fundamentally cautious view of the real estate market remains. The Green Street Commercial Property Price Index showed modest gains in most sectors in the second half of 2025, but the recovery has been uneven, with industrial and certain segments of multifamily leading and office continuing to lag meaningfully¹³.
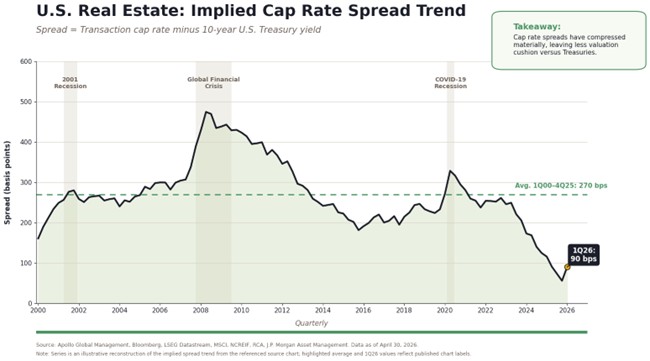
While we have seen some improvement in the earlier part of 2026, implied cap-rate spreads have remained compressed, suggesting that real estate’s valuation cushion relative to Treasuries remains thin. This does not necessarily preclude positive returns, but it does raise the bar for underwriting: forward performance is likely to depend less on broad cap-rate compression and more on durable income growth, disciplined entry basis, and sector selection. A more constructive environment would likely require either lower Treasury yields, stronger NOI growth, or both. Until then, we would expect real estate returns to be more income-driven and uneven across sectors, with limited margin for error in assets priced off tight spreads.
We are perhaps not alone in our continued cautious stance. Real estate fundraising remained subdued through the end of 2025, with closed-end funds gathering meaningfully less capital than in any year of the prior decade outside of 2020¹⁴. While we continue to monitor the segment and have seen some early signals of stabilization and hopes of recovery, we have not yet found the combination of sponsor quality and relative risk-reward attractive enough to add incremental exposure to real estate.
Energy / Natural Resources
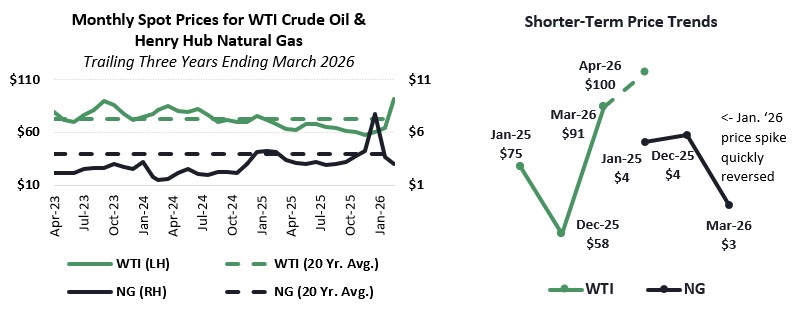
WTI crude oil prices spent much of late 2025 in the $55 to $65 per barrel range, ending the year near $6015. Henry Hub natural gas prices ranged from approximately $3.19-4.26 per MMBtu in the fourth quarter of 2025, with the brutal cold temperatures and significant snowfall for many areas of the U.S. resulting in a spike to almost $8 per MMBtu in January 2026. Both commodities remained meaningfully below their 2022 peaks through the end of 2025 but broadly consistent with their 20-year averages. Post year-end, heightened volatility and price spikes have been driven by geopolitical events surrounding the Strait of Hormuz, showing just how sensitive commodity prices can be during periods of unrest in areas such as the Middle East.
Conflict resolution, supply discipline, and the path of global demand will be important determinants of where oil prices settle in 2026. We continue to monitor the impacts on both our existing energy investments and carefully consider the prevailing dynamics when evaluating new investments. Currently, we and our energy managers view natural gas as the more compelling opportunity in the energy complex, both because of constructive long-term demand drivers (e.g. AI-related data center power load) and a more attractive entry from a pricing perspective.
Launch of BPS Vintage Year 2026
In early 2026, we launched and are actively raising our 13th BPS fund, Bespoke Private Strategies Vintage Year 2026 (“BPS VY 2026”). Drawing on what has worked well and the lessons learned over our careers, we remain focused on continuously improving our process, strengthening our network of high-quality manager relationships, and applying the same discipline that has guided the BPS program since inception. Market environments will continue to evolve, but our core objective remains unchanged: to make thoughtful, selective, and well-underwritten decisions that maximize the long-term compounding potential of our investors’ capital.
Thank you for your continued support and trust. As always, our team is available to answer any questions.
Sources: [1 ] MSCI Private Capital Intel, as of December 31, 2025 [2} Company filings and public hyperscaler capital expenditure commentary; Brockenbrough analysis. [3] PitchBook-NVCA Venture Monitor, Q4 2025; S&P Global Market Intelligence; Brockenbrough analysis. [4] Cushman & Wakefield: Americas Data Center Update | H2 2025 [5] McKinsey Global Survey on AI and Stanford AI Index, 2025. [6] Bain & Company, Global Private Equity Report 2026. [7] PitchBook LCD and Bloomberg, as of March 31, 2026. [8] Golub Capital Altman Index, Q4 2025. [9] Federal Reserve and Bain & Company, Global Private Equity Report 2026. [10] MSCI Private Capital Intel, as of December 31, 2025. [11} MSCI Private Capital Intel and public market benchmark data. [12] Bloomberg and PitchBook LCD, as of December 31, 2025; public markets as represented by the S&P 500; private markets by LBO-backed companies. [13] PitchBook, 2025 Annual US VC Valuations Report. [14] PitchBook-NVCA Venture Monitor, Q4 2025. [15] EIA
Important Disclosures
This report shall not constitute an offer to sell, or a solicitation of an offer to buy the interests in Bespoke Private Strategies, LP. No such offer or solicitation will be made prior to the delivery of a definitive private placement memorandum, limited partnership agreement and other materials relating to the matters herein. Before making an investment decision with respect to the fund, potential investors are advised to read carefully the confidential private placement memorandum, the limited partnership agreement and the related subscription documents, and to consult with their tax, legal and financial advisors. An investment in any of these limited partnerships is speculative and involves certain risks and conflicts of interest described in more detail in the private placement memorandum. All investments involve risk including the loss of principal or total loss.
Any indices or other financial benchmarks shown are provided for illustrative purposes only, are unmanaged, reflect reinvestment of dividends and other income and do not reflect the impact of advisory fees. Investors cannot invest directly in an index. Comparisons to indices have limitations because indices have volatility and other material characteristics that may differ from a hedge fund. Any indices or other financial benchmarks used herein were not selected to represent an appropriate benchmark to compare an investor’s performance, but rather to allow for comparison of the investor’s performance to that of a well-known and widely recognized index.
Different types of investments involve varying degrees of risk, and there can be no assurance that the future performance of any specific investment, investment strategy, or product or any non-investment related content, made reference to directly or indirectly in this newsletter will be profitable, equal any corresponding indicated historical performance level(s), be suitable for your portfolio or individual situation, or prove successful. Due to various factors, including changing market conditions and/or applicable laws, the content may no longer be reflective of current opinions or positions. Moreover, you should not assume that any discussion or information contained in this newsletter serves as the receipt of, or as a substitute for, personalized investment advice from Lowe, Brockenbrough & Company, Inc. dba Brockenbrough. To the extent that a reader has any questions regarding the applicability of any specific issue discussed above to his/her individual situation, he/she is encouraged to consult with the professional advisor of his/her choosing. Lowe, Brockenbrough & Company, Inc. is neither a law firm nor a certified public accounting firm and no portion of the newsletter content should be construed as legal or accounting advice. A copy of the Lowe, Brockenbrough & Company, Inc.’s current written disclosure statement discussing our advisory services and fees is available upon request.
The opinions expressed are those of Brockenbrough. The opinions referenced are as of the date of publication and are subject to change due to changes in the market of economic conditions and may not necessarily come to pass. Forward looking statements cannot be guaranteed. Brockenbrough is an investment advisor registered with the U.S. Securities and Exchange Commission. Registration does not imply a certain level of skill or training. More information about Brockenbrough’s investment advisory services can be found in its Form ADV Part 2, which is available upon request.
Semi-Annual Private Investment Commentary